
The Subway Subway
maps transit
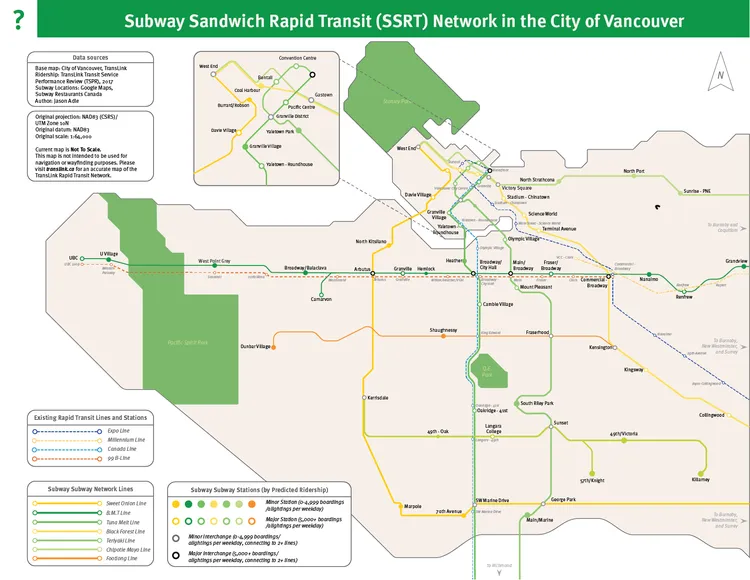
What is a Subway Subway?
As part of my final project for GEOB 372 at the University of British Columbia, I was tasked with creating a map for any topic of my choosing that reflected all that I had learned throughout the course. I opted to do my final project of a “Subway Subway” – in other words, a subway/metro/rapid transit system for the City of Vancouver, with stations based solely on the locations of Subway restaurants.
Project Background
Ever notice how chain restaurants seem to nail the perfect distribution across a city? That’s exactly what kicked off this project. Urbanists across North America had been pointing out something fascinating: if you map out certain restaurant chains, you’ll often end up with better transit coverage than actual public transit systems.
While this observation started as a creative thought experiment on social media, it evolved into a serious conversation about transit accessibility in our cities. Vancouver was missing from this analytical party, so I decided to change that.
Here’s an article on formerly CityLab, now Bloomberg, detailing the concept in depth. Link on Internet Archive ↗
Another article on the Curved archive about the concept ↗
Data Collection Process
The Game Plan
- Build a solid base map of Vancouver (shorelines included)
- Plot existing transit lines
- Track down every Subway restaurant in the city
- Crunch the numbers for theoretical ridership
- Create a professional transit-style map
The Data Hunt
The foundational elements—base map and transit data—were a breeze thanks to Vancouver’s Open Data Portal. Perfect for dropping into ArcGIS or QGIS. But finding every Subway location? That turned into quite the adventure:
- Reached out to Subway Canada (radio silence 👋)
- Checked Vancouver Coastal Health’s Food Asset Map (close, but no sandwich)
- Rolled up my sleeves and plotted each location manually in Google My Maps
Pro tip for future mappers: These days, you could tap into OpenStreetMap or business location databases to save yourself some time.
Here’s the query in Overpass that would’ve done this:
node
  [brand=Subway]
  ({{bbox}});
out;
Data Preparation
Getting from raw data to a workable map was quite the journey. After extracting our initial dataset, I went through several rounds of testing with different software suites and file converters until I found the right ArcGIS-compatible format. (Sometimes the best solutions take a few attempts!)
Station Analysis
To make the station markers meaningful, we pulled ridership data from TransLink’s annual Transit Service Performance Review. This data drove my decision on how each station would be represented visually on the map.
Design Decisions
When it came to the map’s visual approach, I had two paths forward:
- Go full geography-mode with precise distances and detailed shorelines
- Take the schematic route for better clarity and usability
I opted for the schematic approach, taking inspiration from TransLink’s Fast and Frequent Transit Network map (previously known as the Rapid Transit network map before the 2020 RapidBus Network launch).
Visual Identity
The design builds on TransLink’s established visual foundation, using their standard Meta OT font family. While staying true to their core design principles, we developed our own unique twist with:
- A custom color palette
- A sandwich-inspired naming system
- Station markers that scale based on predicted ridership
For those station markers, I calculated sizes using:
- Annual boardings from nearby bus stop pairs
- Ridership stats from adjacent SkyTrain and Canada Line stations